Читать эту же статью на русском 👉 https://dzen.ru/media/samsitblog/from-wl-warning-the-current-thread-ran-into-a-timeout-while-entering-a-writelock-1073741824–lockreason-schedulethreadlib1-64b78e8f338eaf5590a45c0e
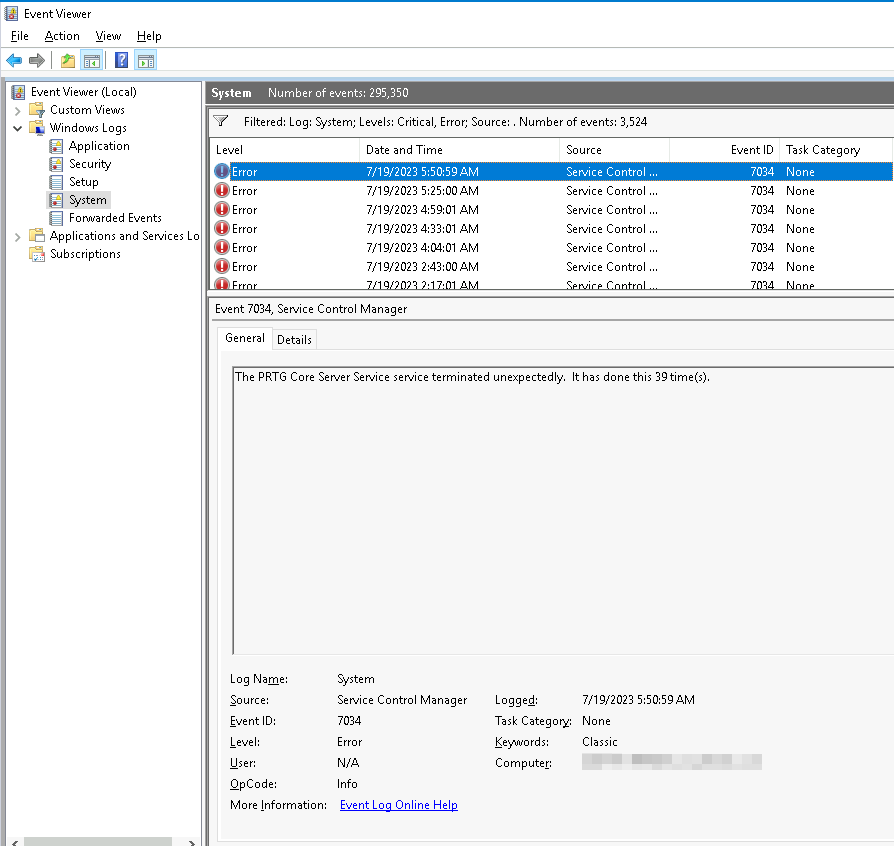
Recently, I got on the PRTG Server strange behavior of PRTG Core Server Service. The service restarted each 20 min and, in fact, the monitoring doesn’t work at all.
I decided to look at the logs of the PRTG Core Server that are located on the <PRTG Root Folder>\Logs\core (in my case D:\PRTG Network Monitor\Logs\core). In the core.log, I found a great number of errors related to read or write timeout.
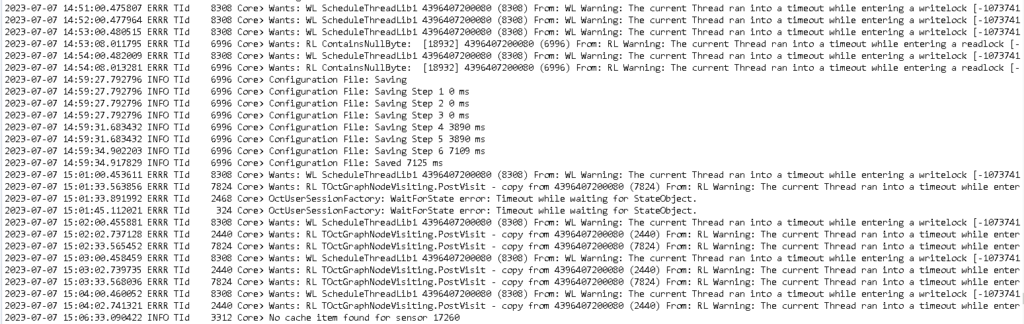
The errors may look like
From: RL Warning: The current Thread ran into a timeout while entering a readlock [-1073741824]
Core> Wants: WL ScheduleThreadLib1 4397018499376 (2596) From: WL Warning: The current Thread ran into a timeout while entering a writelock [-1073741824] . LockReason: “ScheduleThreadLib1” Lockinfos: 1. Thread(1080): WriteLocked LockReason: NewChannel: 18932
Digging deeper into this log I found the next line:
Sensors that exceed 200 channels: (3 total) 18932, 18933, 18922

The numbers 18932, 18933, 18922 in the log are sensor id the PRTG. Inserting this number in the PRTG search box, I found a beautiful sensor with an enormous amount of docker virtual volume.
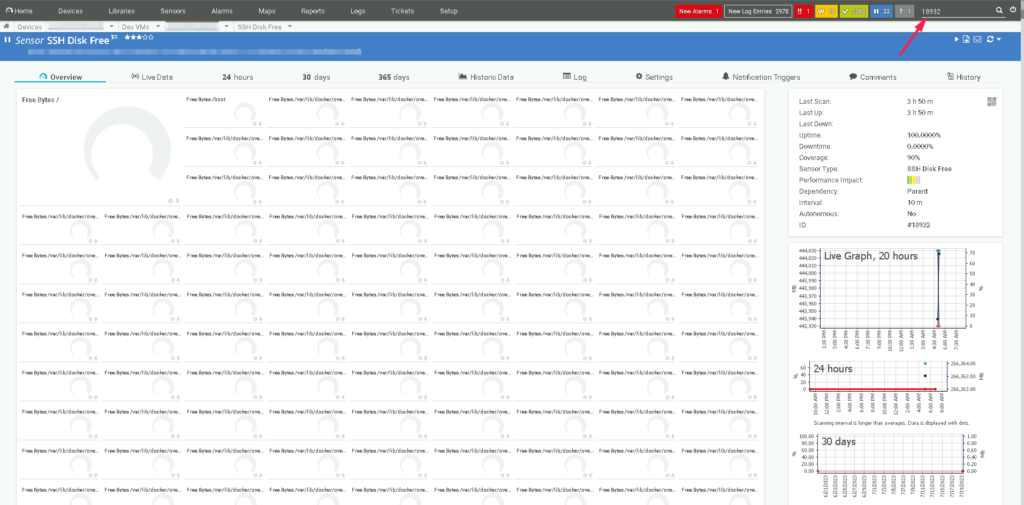
The solution is to pause the sensor. The best option is completely removing the sensor. The PRTG has an internal logic that restarts itself each 20 min to reset any timeout locks